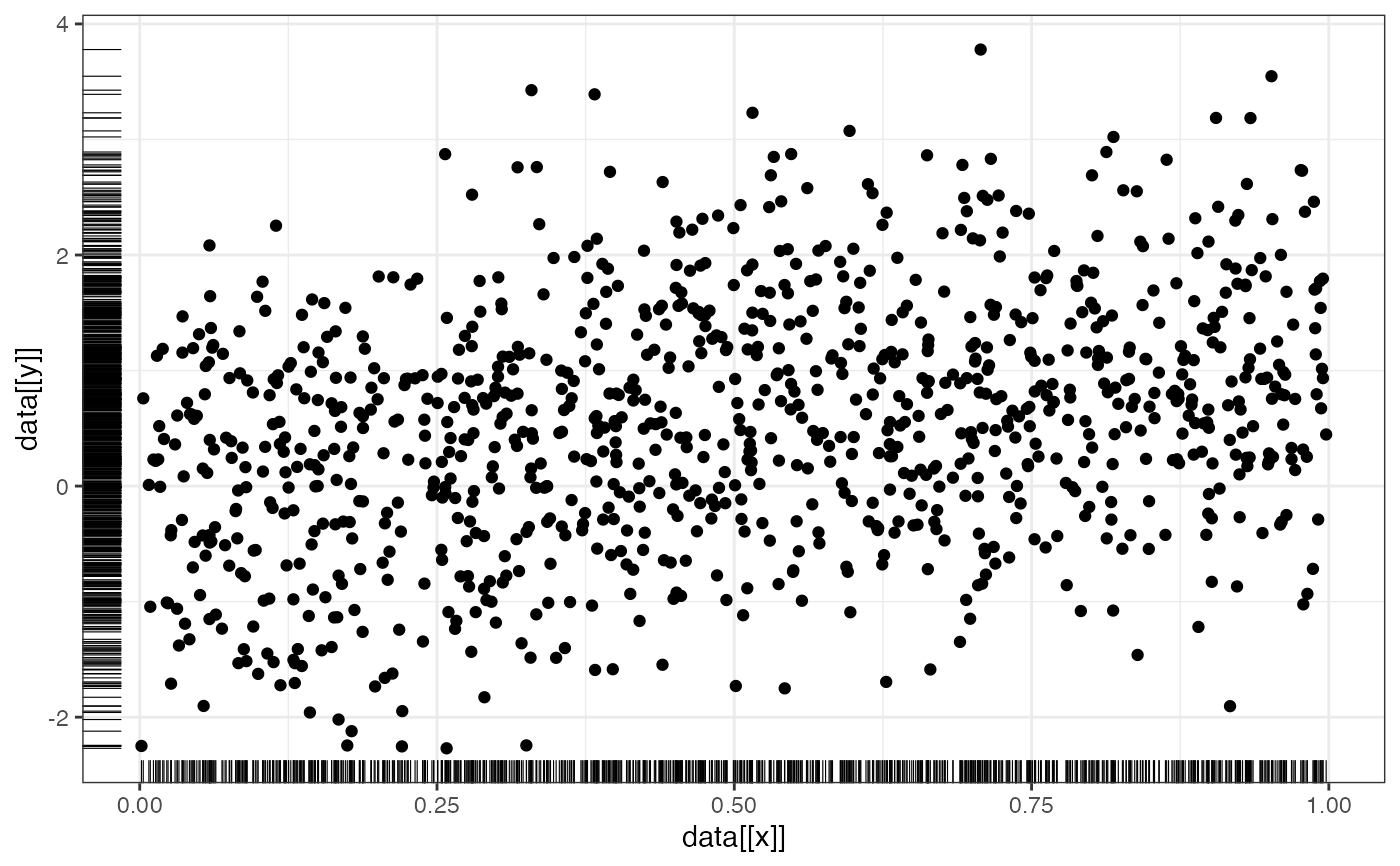
Draws a scatterplot and adds marks along each axis at the observed values.
Author
Charles Crabtree charles.crabtree@monash.edu
Examples
a <- runif(1000, min = 0, max = 1)
b <- a + rnorm(1000, mean = 0, sd = 1)
data <- data.frame(a, b)
bivarrugplot("a", "b", data)
#> Warning: Using `size` aesthetic for lines was deprecated in ggplot2 3.4.0.
#> ℹ Please use `linewidth` instead.
#> ℹ The deprecated feature was likely used in the plotrr package.
#>   Please report the issue at <https://github.com/lobsterbush/plotrr/issues>.
#> Warning: Use of `data[[x]]` is discouraged.
#> ℹ Use `.data[[x]]` instead.
#> Warning: Use of `data[[y]]` is discouraged.
#> ℹ Use `.data[[y]]` instead.
#> Warning: Use of `data[[x]]` is discouraged.
#> ℹ Use `.data[[x]]` instead.
#> Warning: Use of `data[[y]]` is discouraged.
#> ℹ Use `.data[[y]]` instead.