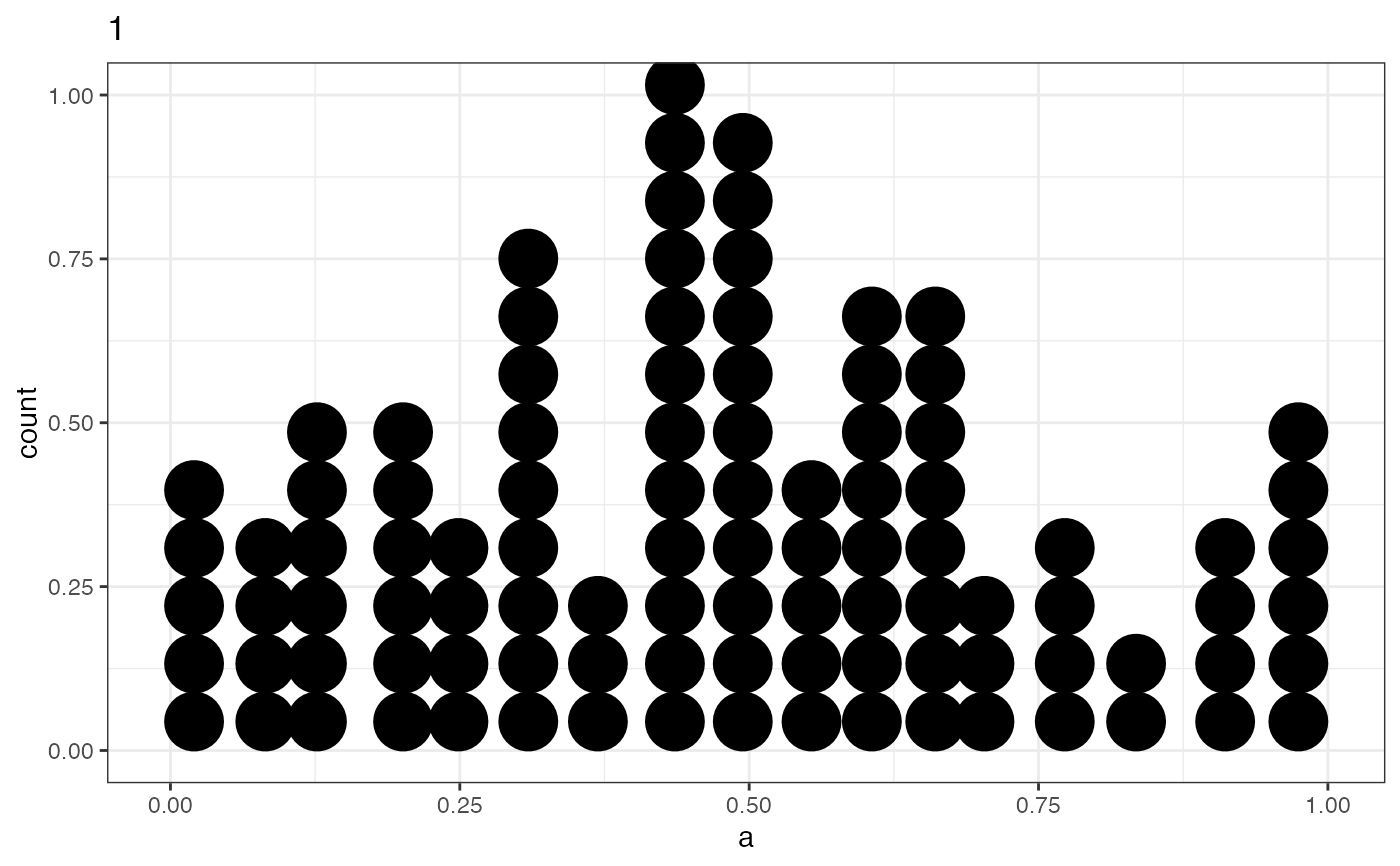
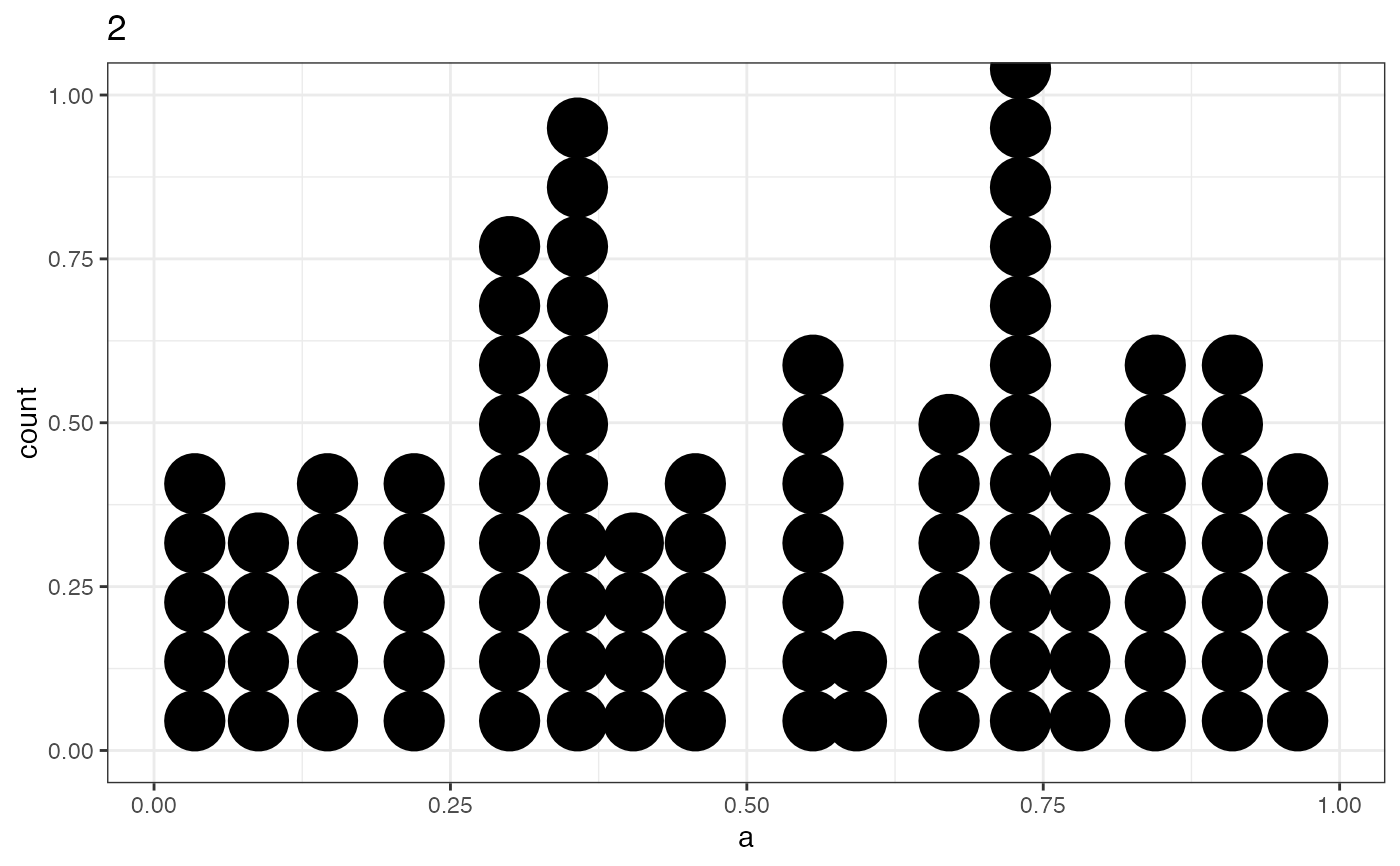
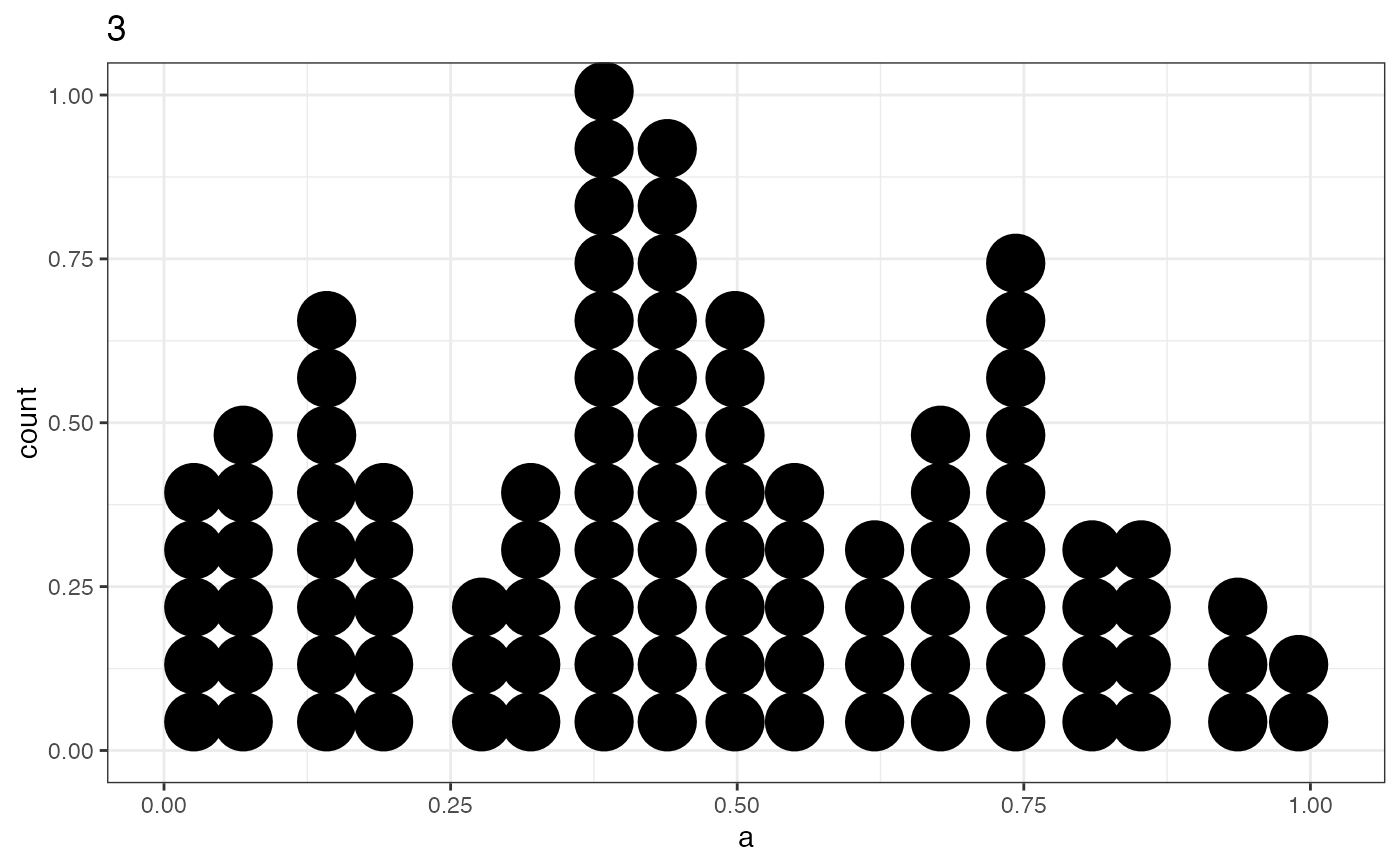
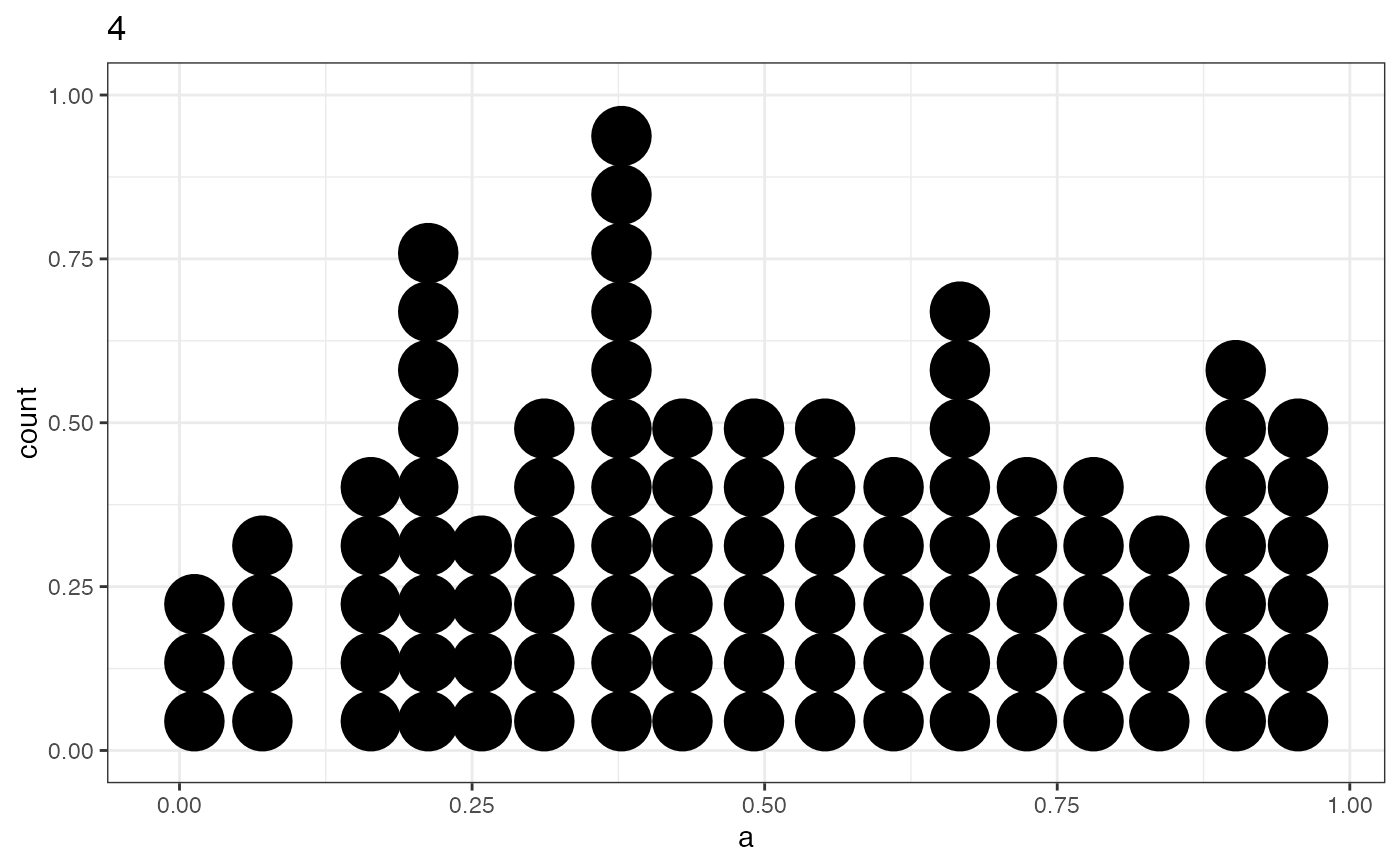
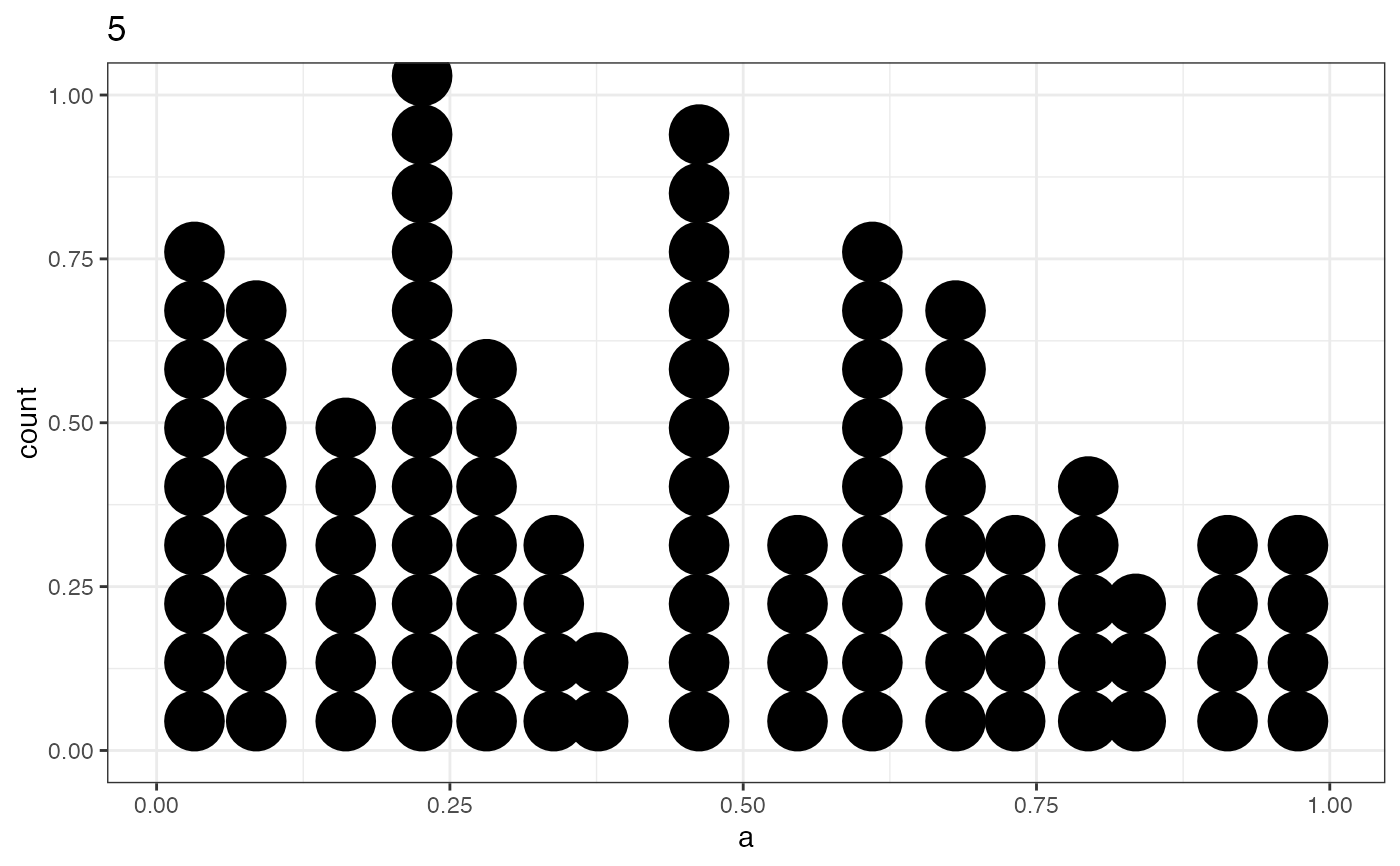
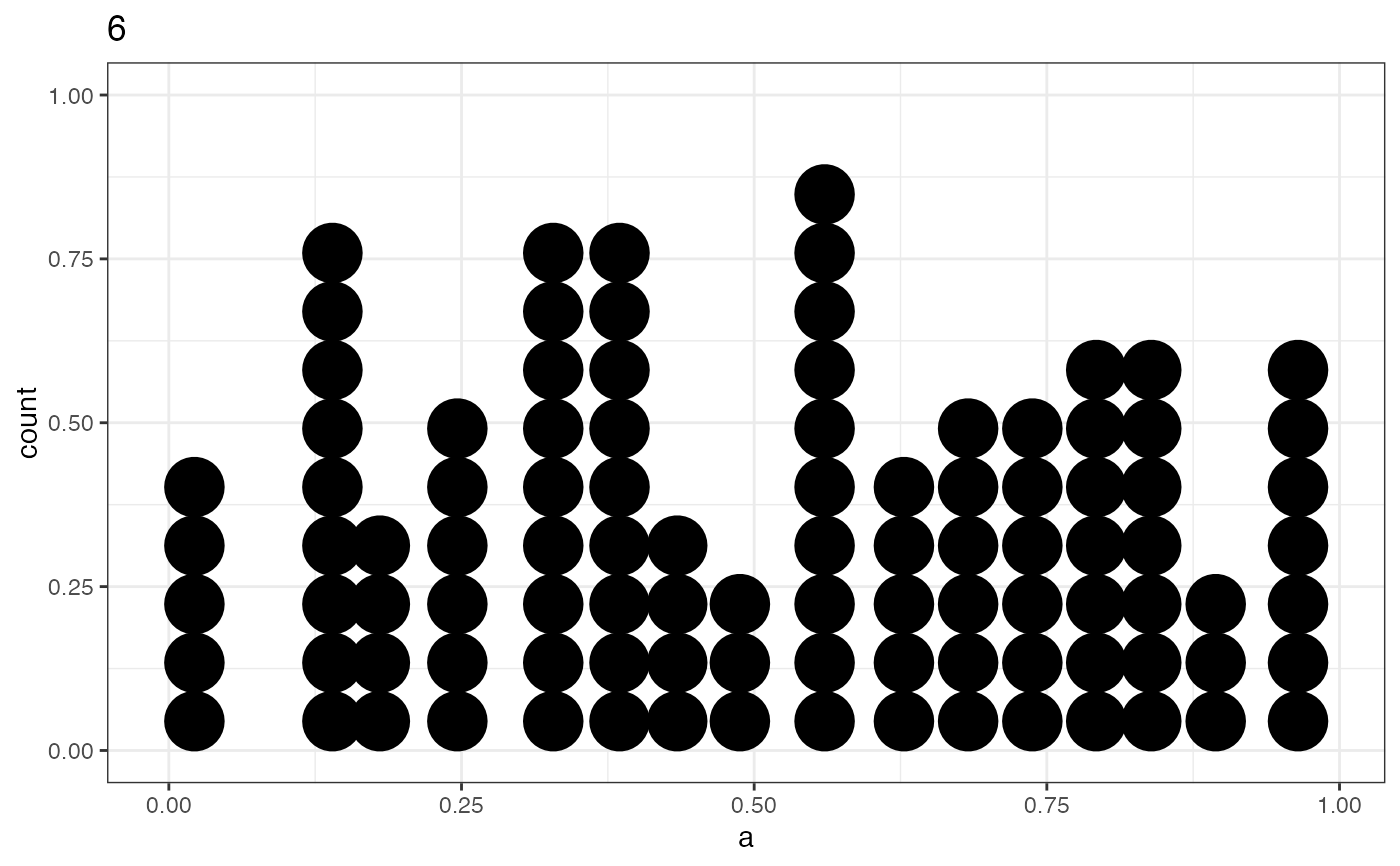
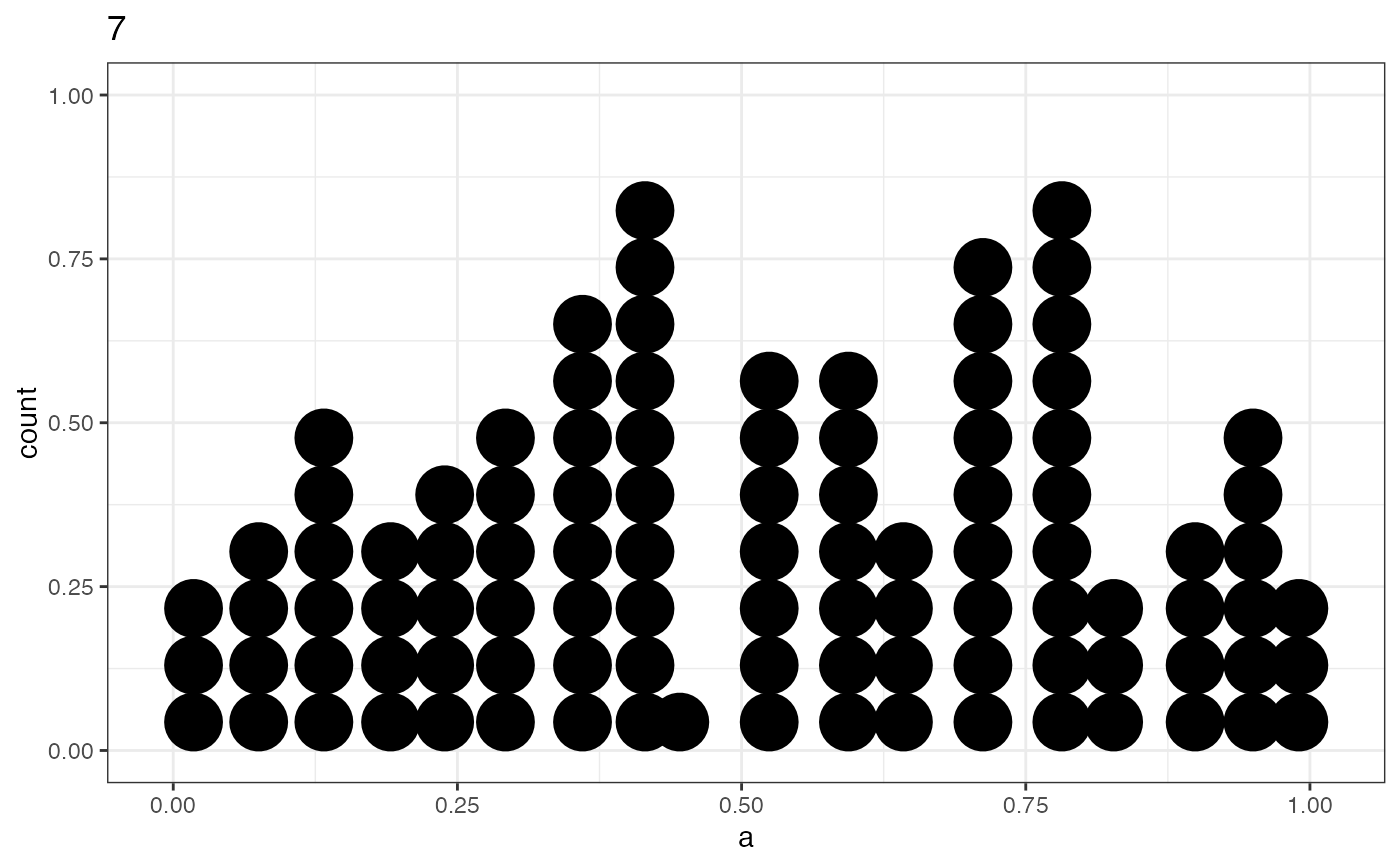
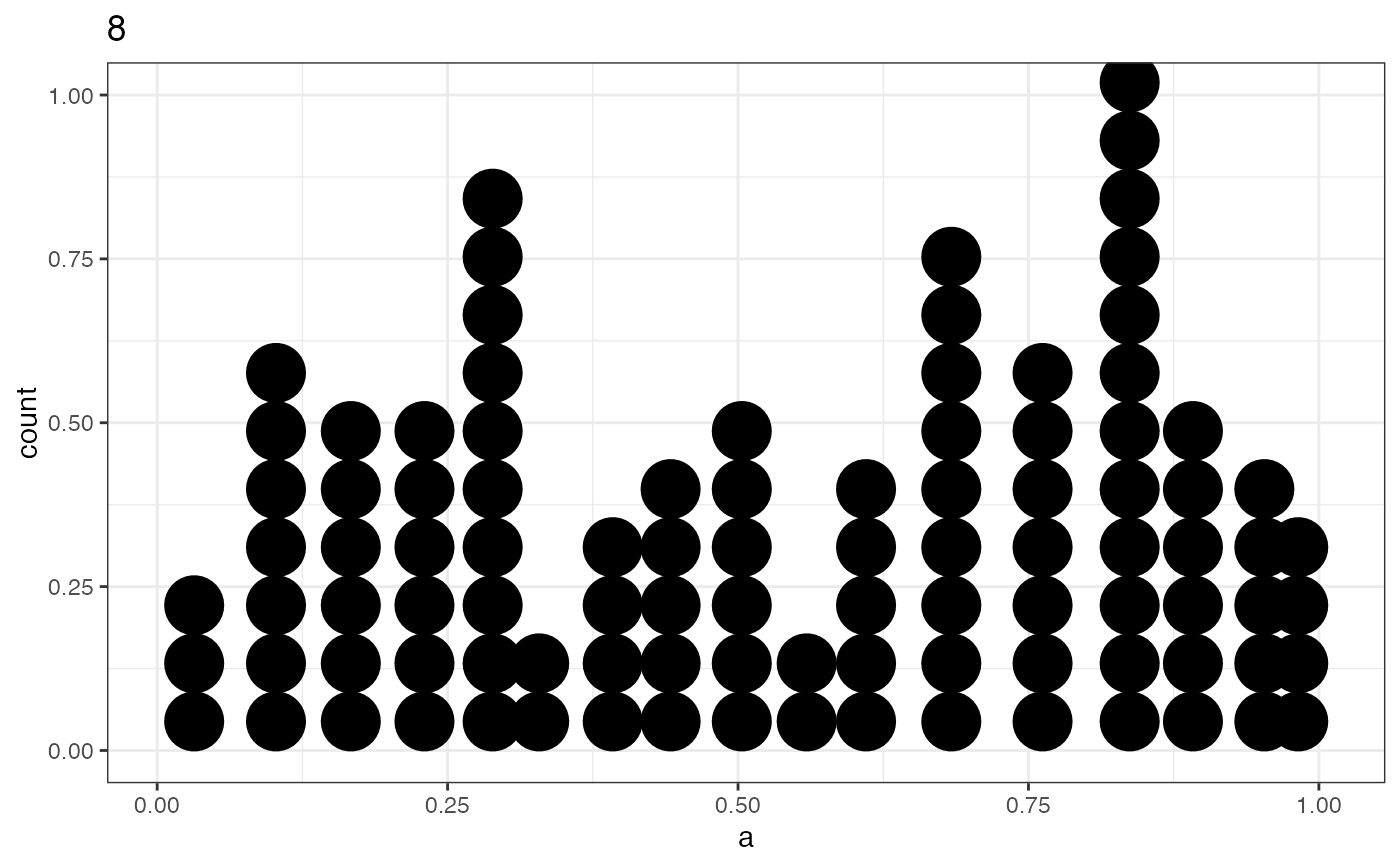
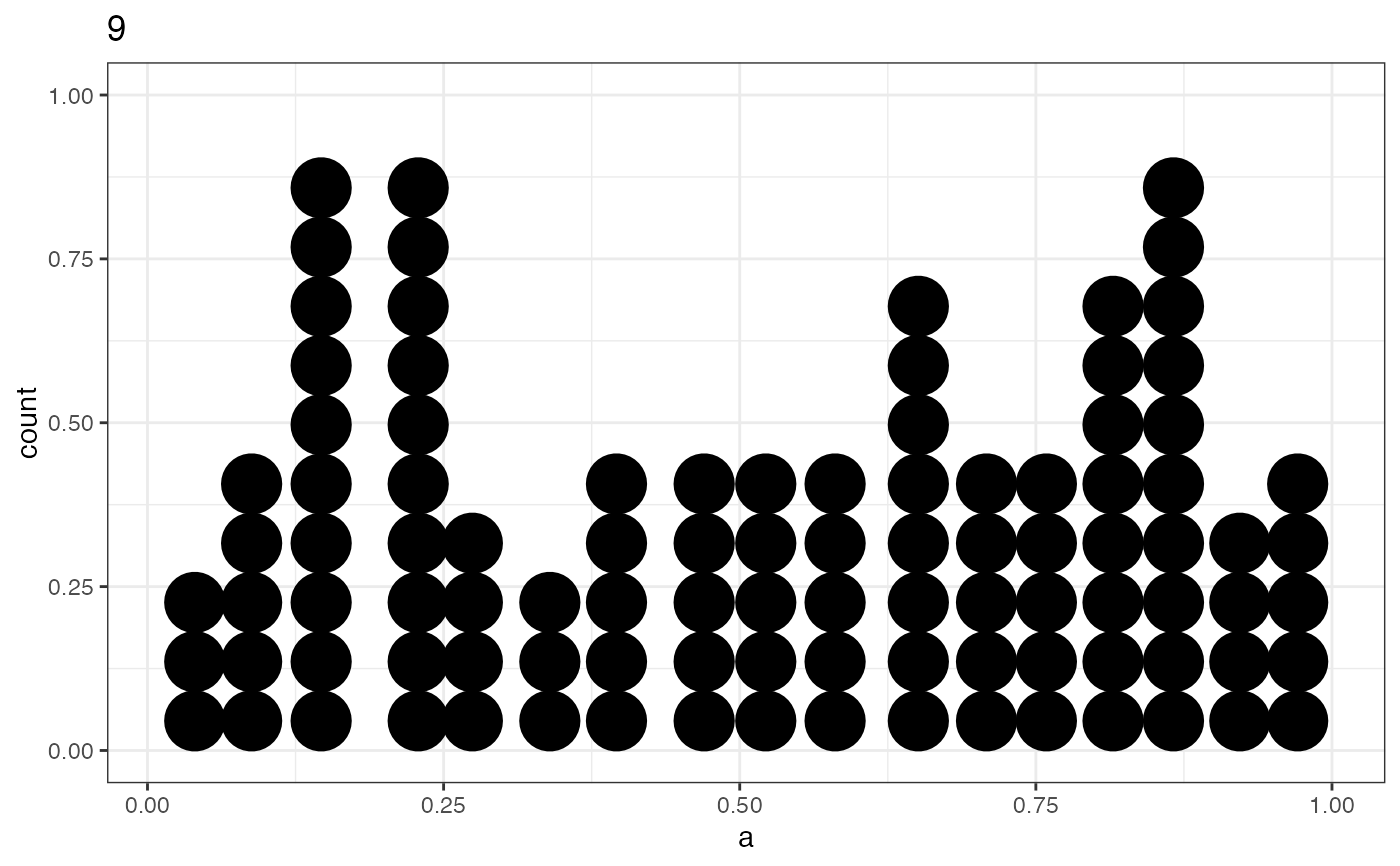
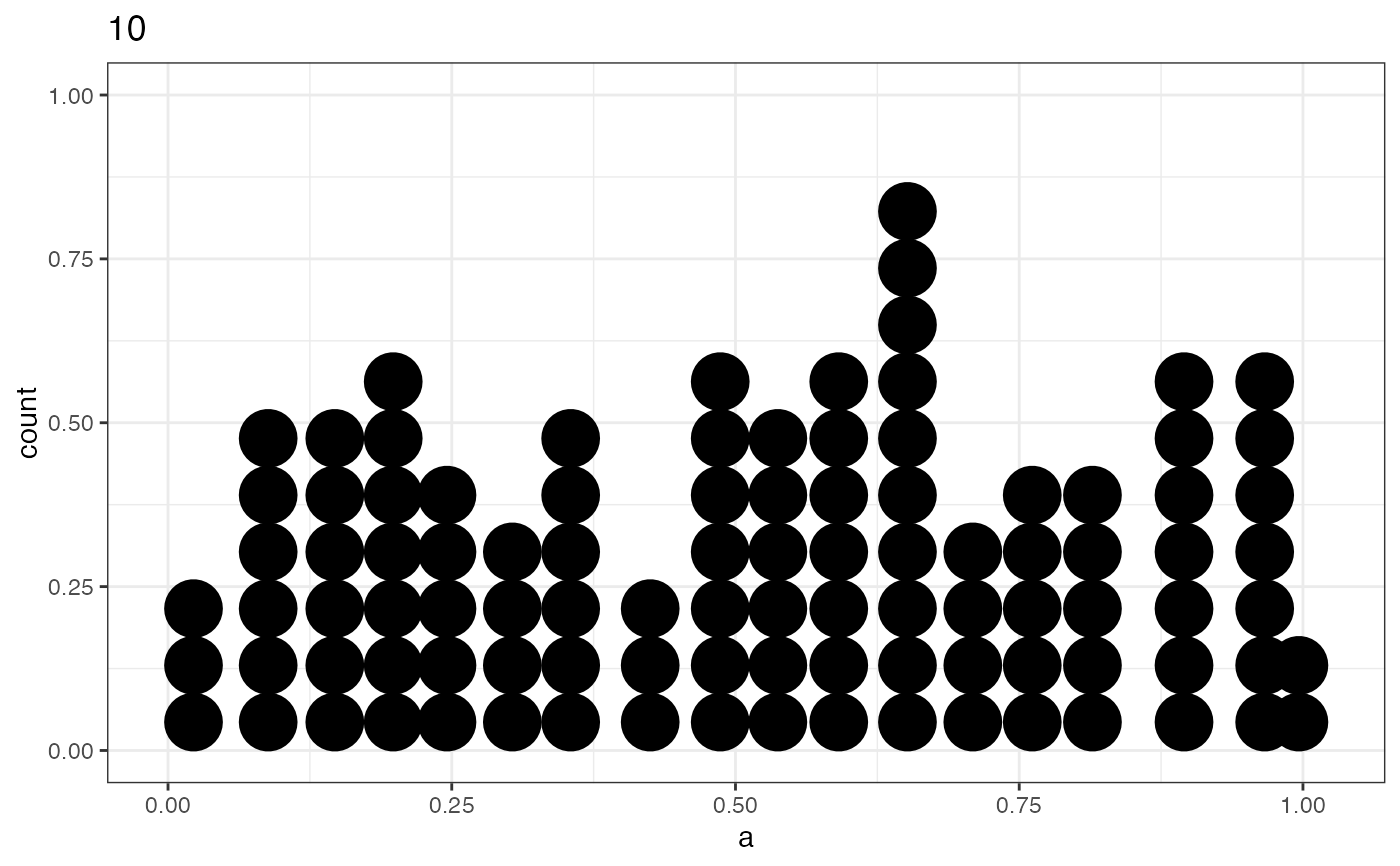
Draws the distribution of x separately for each group.
Usage
dotplots(x, y, group, data, n)
Arguments
- x
The name of the x column, as a string.
- y
Kept for compatibility; this function doesn't use it.
- group
The name of the grouping column, as a string.
- data
A data frame.
- n
Sets the bin width to 1/n. Try a few values to find a useful level of detail.
Value
Prints one dot plot per group. The function returns NULL invisibly.
Examples
a <- runif(1000, min = 0, max = 1)
b <- a + rnorm(1000, mean = 0, sd = 1)
c <- rep(c(1:10), times = 100)
data <- data.frame(a, b, c)
dotplots("a", "b", "c", data, 20)