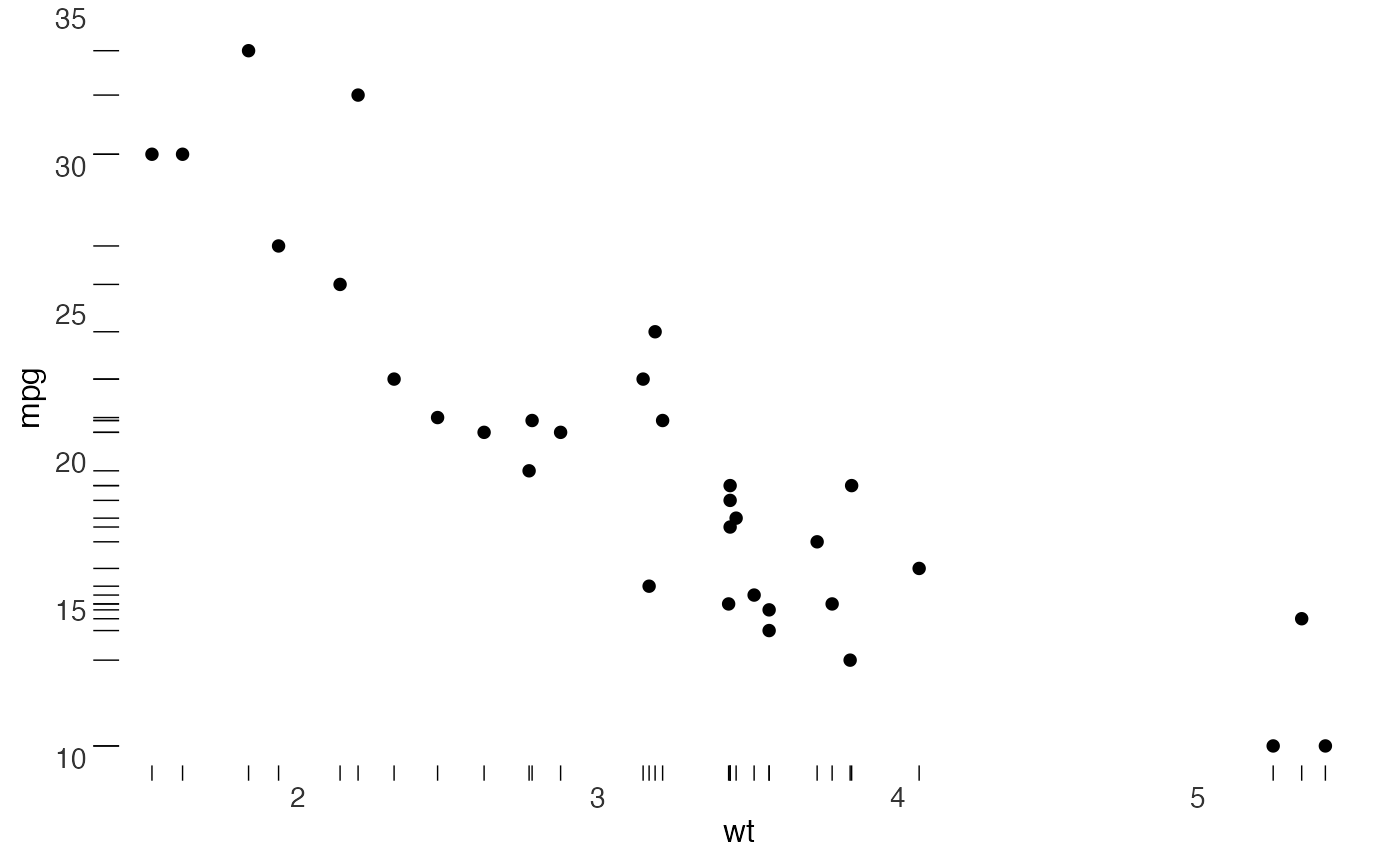
Add a short tick for each observation along the plot's margins. Tufte's dot-dash plot uses these ticks to show the marginal distributions beside a scatterplot.
Usage
geom_dotdash(
  mapping = NULL,
  data = NULL,
  stat = "identity",
  position = "identity",
  ...,
  sides = "bl",
  tick_length = grid::unit(0.02, "npc"),
  na.rm = FALSE,
  show.legend = NA,
  inherit.aes = TRUE
)Details
The default ticks are short and thin. Use theme_tufte(ticks = FALSE)
if you'd like them to replace the ordinary axis ticks.
Examples
library(ggplot2)
ggplot(mtcars, aes(wt, mpg)) +
  geom_point() +
  geom_dotdash() +
  theme_tufte(ticks = FALSE)