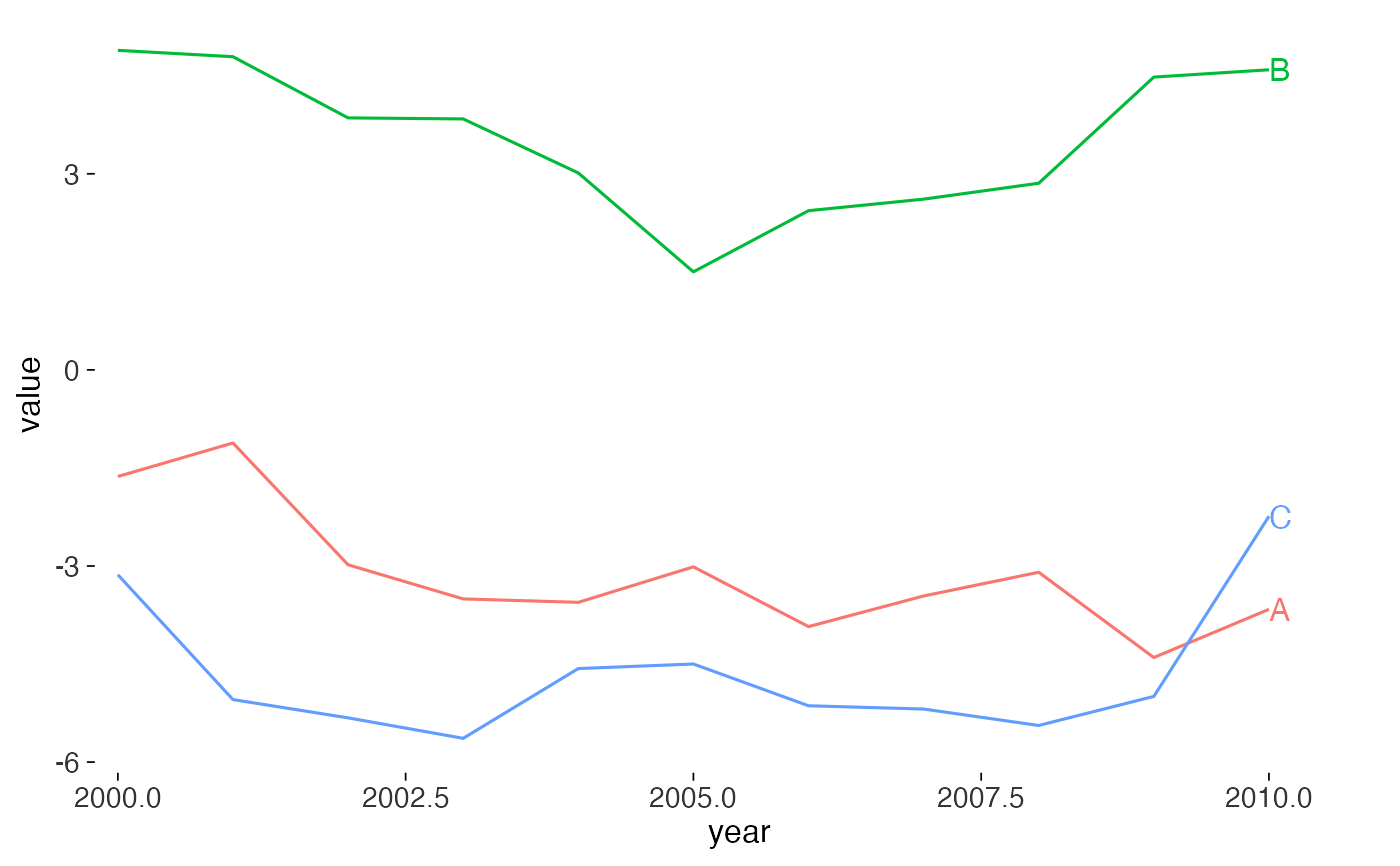
Put a series name beside its line so readers can identify it without
looking up a legend. This follows Tufte's advice to bring text and graphics
together. geom_text_last() labels each group at its largest x value;
geom_text_first() labels it at the smallest.
Usage
geom_text_last(
  mapping = NULL,
  data = NULL,
  position = "identity",
  ...,
  nudge_x = 0,
  nudge_y = 0,
  hjust = 0,
  vjust = 0.5,
  geom = c("text", "label"),
  na.rm = FALSE,
  show.legend = FALSE,
  inherit.aes = TRUE
)

geom_text_first(
  mapping = NULL,
  data = NULL,
  position = "identity",
  ...,
  nudge_x = 0,
  nudge_y = 0,
  hjust = 1,
  vjust = 0.5,
  geom = c("text", "label"),
  na.rm = FALSE,
  show.legend = FALSE,
  inherit.aes = TRUE
)
Arguments
- mapping, data, position, na.rm, show.legend, inherit.aes, ...
Standard
ggplot2layer arguments. Seelayer(). Thelabelaesthetic is required, exactly asgeom_text()requires it: pass the column holding the series name, usually the same one you mapped tocolour.- nudge_x, nudge_y
Offsets applied to the label position, in data units.
- hjust, vjust
Text justification. Sensible defaults are chosen per side.
- geom
Either
"text"(the default) or"label".
Details
Leave room for the labels. You can widen the x scale with
expansion(), or use
coord_cartesian(clip = "off") with a suitable plot margin.
These layers don't move overlapping labels apart.
Examples
library(ggplot2)
d <- data.frame(
  year = rep(2000:2010, 3),
  value = c(cumsum(rnorm(11)), cumsum(rnorm(11)) + 3, cumsum(rnorm(11)) - 3),
  series = rep(c("A", "B", "C"), each = 11)
)
ggplot(d, aes(year, value, colour = series)) +
  geom_line() +
  geom_text_last(aes(label = series)) +
  scale_x_continuous(expand = expansion(mult = c(0.02, 0.1))) +
  theme_tufte() +
  theme(legend.position = "none")