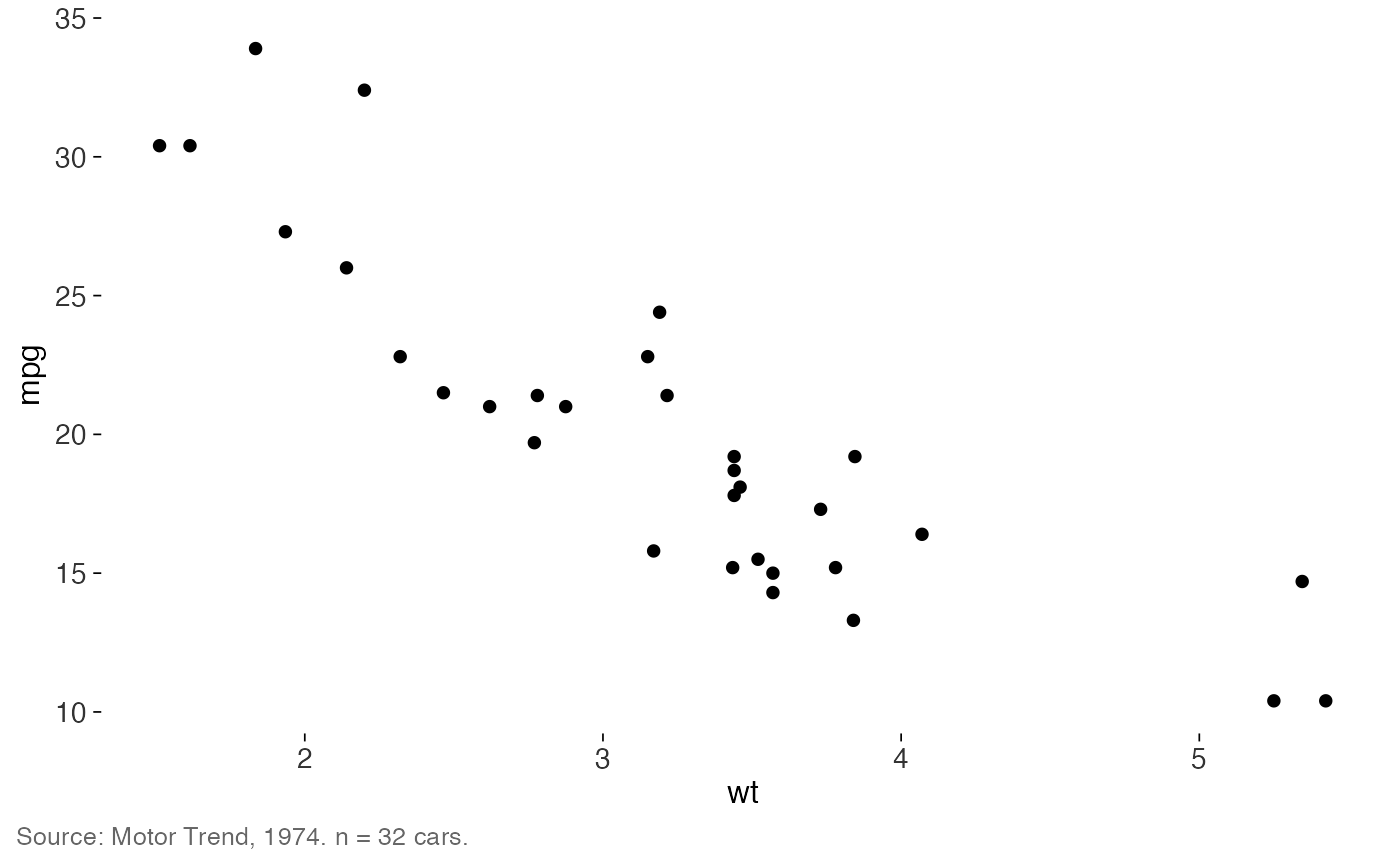
Name the data source on the figure so readers can check where the numbers
came from. This follows Tufte's documentation principle and wraps
labs(caption = ...) with consistent formatting.
Examples
library(ggplot2)
ggplot(mtcars, aes(wt, mpg)) +
  geom_point() +
  theme_tufte() +
  label_source("Motor Trend, 1974", note = "n = 32 cars.")