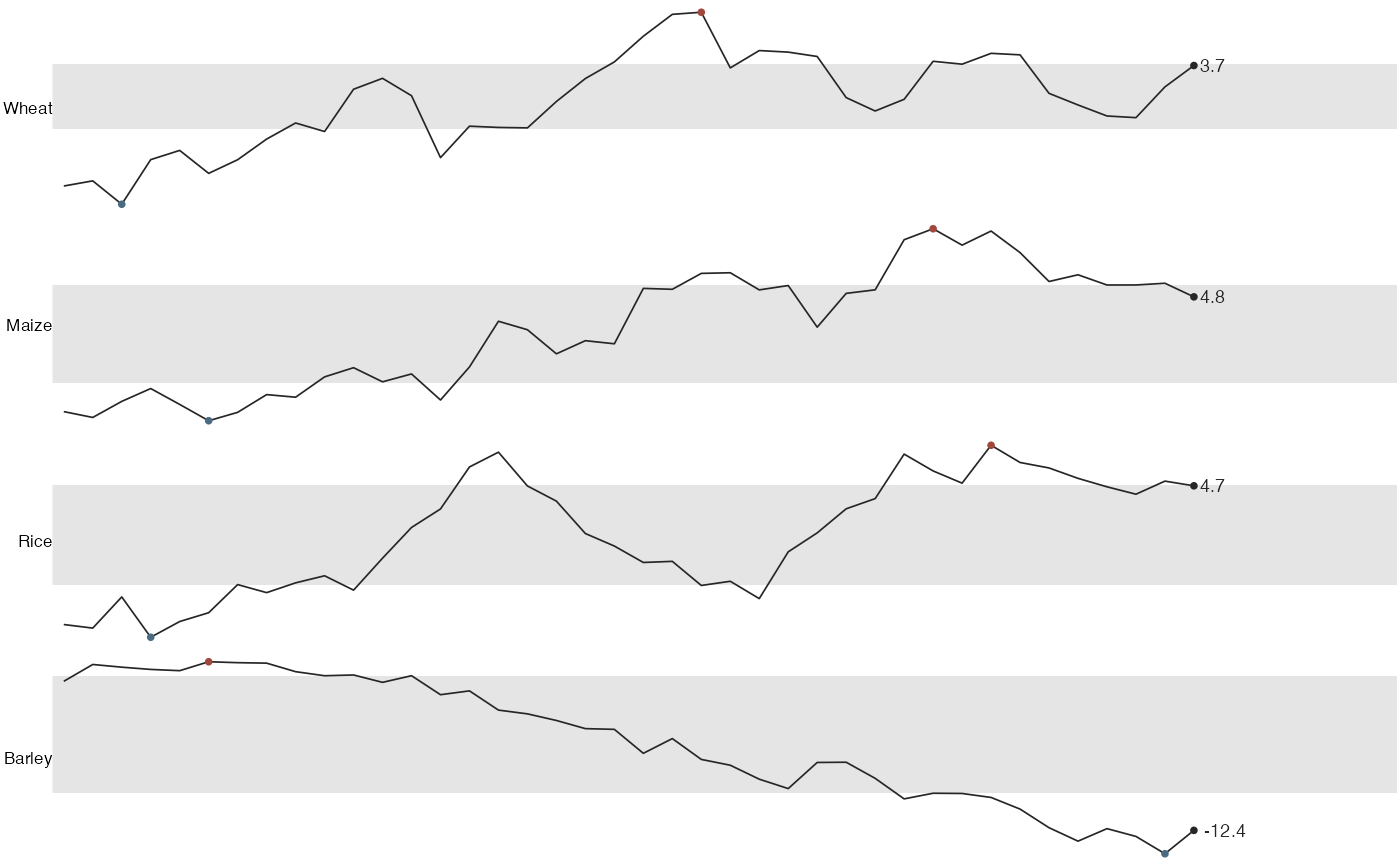
Stack one sparkline per series, with its name on the left and final value on the right. Each series has its own vertical scale.
Usage
sparklines(
  data,
  x,
  y,
  group,
  band = c(0.25, 0.75),
  band_fill = "grey90",
  extremes = TRUE,
  label = TRUE,
  accuracy = 0.1,
  big.mark = ",",
  colour = "grey15",
  linewidth = 0.3
)
Arguments
- data
A data frame.
- x, y, group
Bare column names for position, value and series.
- band, band_fill, colour, linewidth, accuracy, big.mark
As in
sparkline().- extremes
Logical. Mark each series' minimum and maximum?
- label
Logical. Print each series' final value at the right?
Details
This is useful for comparing patterns over time. To compare levels across
series on a shared scale, use facet_tufte().