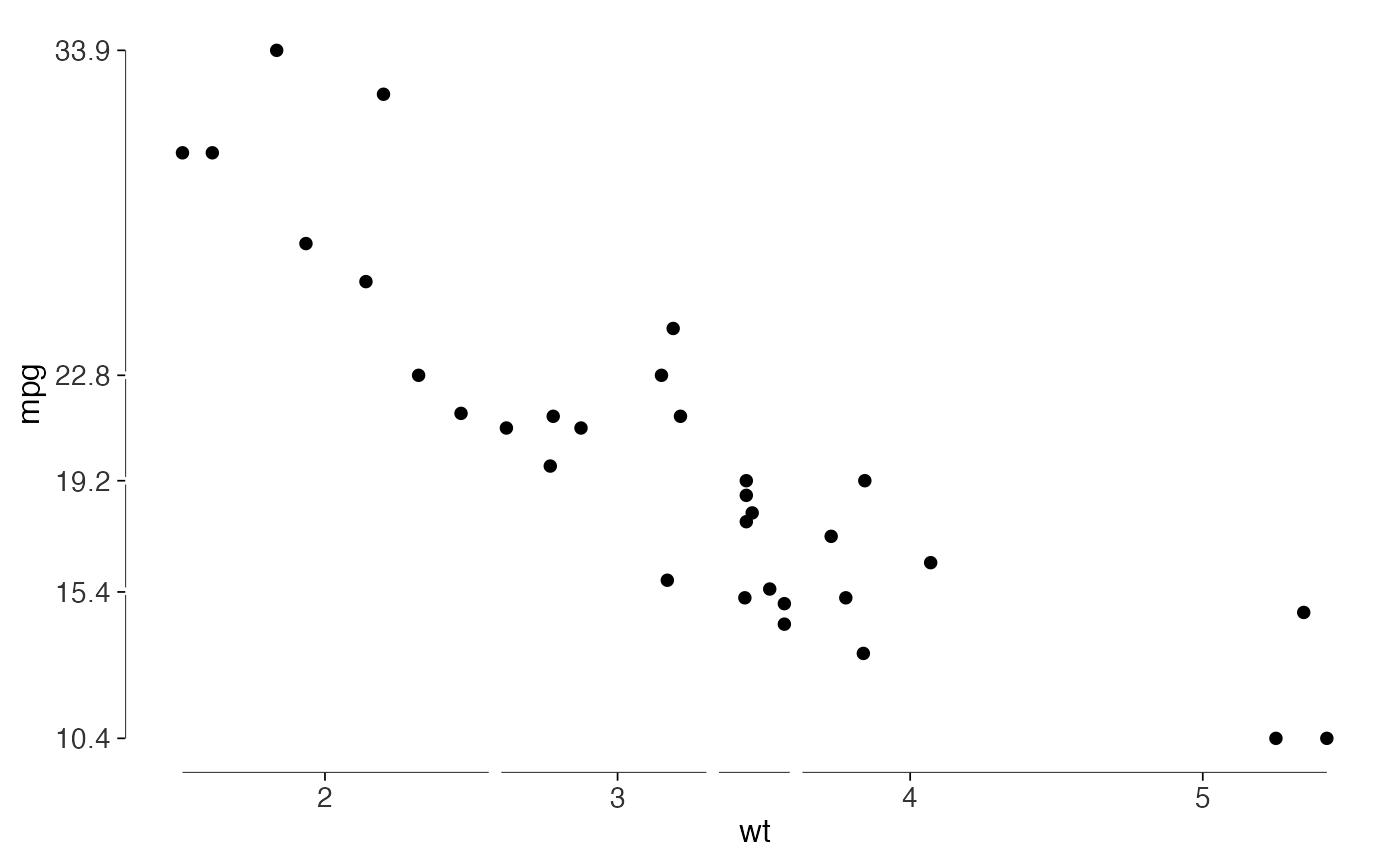
Label the minimum, quartiles, median and maximum at the positions shown by
geom_quartileframe(). This follows Tufte's use of the axis to
show the distribution.
Arguments
- x
Optional numeric vector. If supplied, the breaks are computed from it once, which is what you want when the axis limits are wider than the data. If omitted, breaks are computed from the scale's own limits.
- digits
Number of significant digits to round the breaks to. Defaults to 3.
- min_gap
Minimum spacing between breaks, as a fraction of the data range; breaks closer than this to the one before them are dropped. Defaults to
0, which keeps the whole five-number summary. Any value you set is a judgement about your own font and figure size, so it belongs in your code rather than in a default here.
Details
All five values are kept by default. Set min_gap to omit crowded
breaks. The space labels need depends on your font, figure size and number
of digits, so there's no single spacing that works for every figure.
Use check_labels_fit() and inspect the saved result.
Examples
library(ggplot2)
ggplot(mtcars, aes(wt, mpg)) +
  geom_point() +
  geom_quartileframe() +
  scale_y_continuous(breaks = quartile_breaks(mtcars$mpg)) +
  theme_tufte()